
Student Profiling for your lecture
People profiling problem can be approached as an analysis of co-occurrence, how often lectures are chosen together and correlation, the strength and direction of the relationship between choosing lecture X and choosing other lectures.
Frequency Analysis for Profiling
This is the most direct approach to identify the most and least selected lectures by your L6 students.
- Filter Data: Isolate the rows (students) who selected L6.
- Calculate Frequencies: For this subset of L6 students, count how many of them selected each of the other available lectures (L1, L2, L3, etc.).
- Most Selected: The lectures with the highest counts.
- Least Selected: The lectures with the lowest counts (or those not selected at all).
Association Rule Mining – Co-occurrence
This sophisticated approach, often used in market basket analysis, can determine which lectures are most frequently chosen together with L6.
- Support: The proportion of L6 students who also selected a specific lecture (e.g., L3).
- Confidence: The likelihood that a student selected L6 given that they selected another lecture (e.g., L3 → L6), or vice-versa.
- Lift: A measure of how much more likely a student is to select L3 if they also selected L6, compared to the overall likelihood of selecting L3. A Lift >1 suggests a positive association (students who take one tend to take the other).
Correlation Analysis – the Strength and Direction of Relation – application in Profiling
This method quantifies the relationship between selecting L6 and selecting any other lecture (Lx). Since the selection data is binary (0 for not selected, 1 for selected), you would use a correlation measure suitable for binary variables. Profiling.
- Phi Coefficient (ϕ): This is a measure of association for two binary variables. It ranges from −1 to +1.
- Strong Positive Correlation (ϕ≈+1): Students who select L6 are highly likely to also select Lx. This suggests the lectures are perhaps complementary or targeted at the same student group.
- Strong Negative Correlation (ϕ≈−1): Students who select L6 are highly likely to not select Lx. This suggests the lectures might be alternatives, require conflicting time slots, or appeal to entirely different student interests.
- Weak/No Correlation (ϕ≈0): Selection of L6 has little to no impact on the selection of Lx.
Dimensionality Reduction – Clustering
For a very large number of lectures, you could use methods like Principal Component Analysis (PCA) or clustering algorithms to group similar students or lectures together. This can identify underlying student profiles (e.g., “The Data Science Crowd” or “The Humanities Enthusiasts”) that include L6 as part of their typical selection.
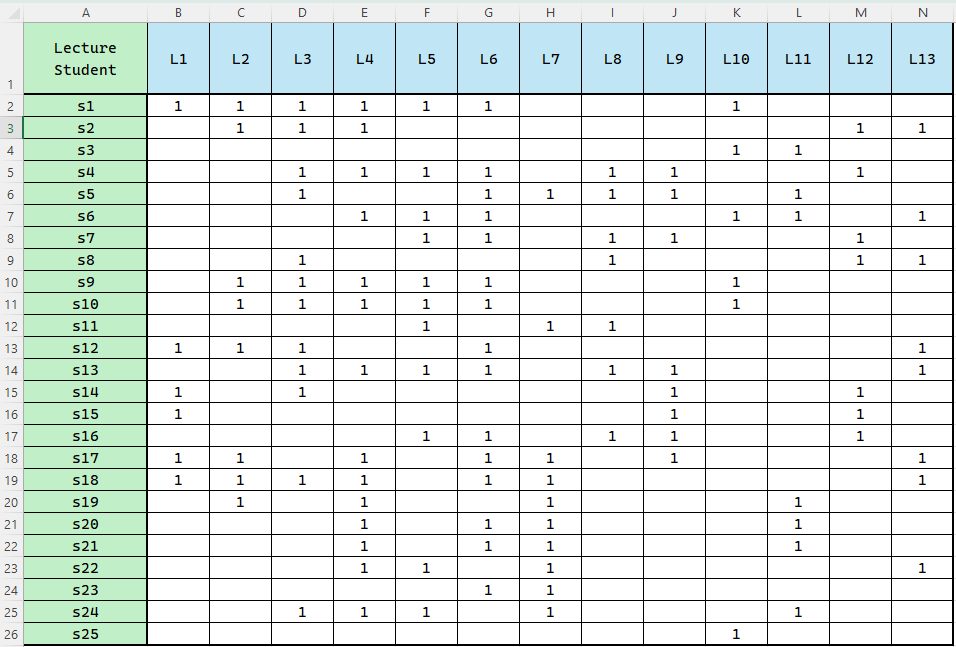
In this table there are students (in rows) selection of lectures (in column). My lecture is L6. I would like to know a profile of my students. so which lectures they selected the most and which the least. How strong the relations are (positive and negative if they omit some lectures.
Profile of L6 Students: Most and Least Selected Lectures
This is a Frequency Analysis of the lectures selected by the 11 students who chose L6. The percentages are based on the total number of L6 students (15).
Most Selected Lectures – The “Typical Package”: Your L6 students most frequently select L4 (67%), L3 (53%), and L5 (53%). These three form the core lecture package with L6. Least Selected Lecture: L12 is the least popular choice, selected by only 3 out of 15 students (20%).
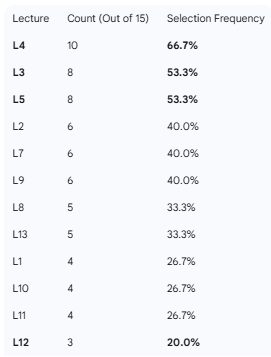
Strength of Relation: Correlation Analysis
The Phi Coefficient quantifies the strength and direction of the relationship between choosing L6 and choosing any other lecture, using all 25 students in the dataset.
Strongest Positive Relations (Complementary): L4 (ϕ=0.263) and L5 (ϕ=0.230) show the strongest positive correlation with L6. This suggests that students interested in L6 are often those who also select L4 and L5.
Strongest Negative Relation (Alternative/Avoided): L12 (ϕ=−0.218) shows the only notable negative correlation. This confirms the frequency finding, suggesting L12 may be an alternative path or have a conflicting time/prerequisite with L6.
Weak/No Relation: Lectures like L3 and L7 have a high selection frequency but a very weak (L3) or zero (L7) correlation. This indicates that while many L6 students do take these, they are likely popular lectures chosen by many students across the board, and the choice of L6 is not a significant predictor of their selection.
Association Rule Mining
By analyzing the entire student population, we can discover general student curriculum patterns that exist beyond your specific L6 cohort. I used Association Rule Mining metrics (Support, Confidence, and Lift) to find lecture pairs that are frequently selected together.
- Support: The percentage of all 25 students who selected both lectures.
- Lift: A measure of how much the selection of one lecture increases the chance of selecting the other. A Lift>1.2 indicates a strong, meaningful positive association.
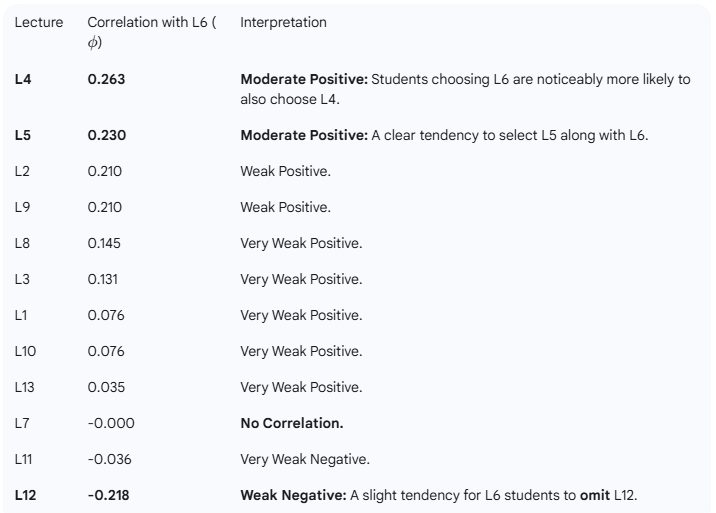
Here are the top co-selected lecture groups (pairs) among the entire student population, filtered for those selected by at least 16% of students and showing a strong positive association (Lift>1.2):
Python
import pandas as pd
from io import StringIO
import itertools

# Read the data
df = pd.read_csv(StringIO(csv_data), sep=';')
N_students = len(df)

lecture_cols = [col for col in df.columns if col.startswith('L')]
lecture_df = df[lecture_cols].fillna(0).astype(int)

# --- Association Rule Mining (Pairs) ---
# 1. Calculate Support for individual lectures
support_single = lecture_df.sum() / N_students

# 2. Calculate Support and Lift for all pairs
association_rules = []
for l1, l2 in itertools.combinations(lecture_cols, 2):
    # Calculate Support for the pair: count students who selected both
    co_selection_count = (lecture_df[l1] * lecture_df[l2]).sum()
    support_pair = co_selection_count / N_students

    # Calculate Lift: (Support(L1 and L2)) / (Support(L1) * Support(L2))
    # Handle division by zero if single support is 0, though unlikely here
    if support_single[l1] > 0 and support_single[l2] > 0:
        lift = support_pair / (support_single[l1] * support_single[l2])
    else:
        lift = 0

    # Calculate Confidence (L1 -> L2)
    confidence_l1_to_l2 = support_pair / support_single[l1] if support_single[l1] > 0 else 0

    association_rules.append({
        'Antecedent': l1,
        'Consequent': l2,
        'Support': support_pair,
        'Confidence (L1 -> L2)': confidence_l1_to_l2,
        'Lift': lift
    })

# Convert to DataFrame
rules_df = pd.DataFrame(association_rules)

# Filter for meaningful associations:
# 1. Minimum Support: Selected by at least 4 students (4/25 = 0.16)
# 2. Lift > 1.2: A strong positive relationship
min_support = 4 / N_students  # 0.16

# Filter and sort the results by Lift
top_associations = rules_df[
    (rules_df['Support'] >= min_support) &
    (rules_df['Lift'] > 1.2)
].sort_values(by='Lift', ascending=False).reset_index(drop=True)

# Add the reverse rules (L2 -> L1) to the table where Lift is high.
# Since Lift is symmetrical, only one direction needs to be calculated, but Confidence is not.

# Helper function to get Confidence (L2 -> L1) for presentation
def get_confidence_l2_to_l1(row):
    l1 = row['Antecedent']
    l2 = row['Consequent']
    support_pair = row['Support']
    return support_pair / support_single[l2] if support_single[l2] > 0 else 0

top_associations['Confidence (L2 -> L1)'] = top_associations.apply(get_confidence_l2_to_l1, axis=1)

# Reorder columns for presentation
top_associations = top_associations[['Antecedent', 'Consequent', 'Support', 'Confidence (L1 -> L2)', 'Confidence (L2 -> L1)', 'Lift']]

print("Top Co-Selected Lecture Groups (Pairs):")
print(top_associations.to_markdown(index=False, floatfmt=".3f"))
Interpretation of Lecture Groups
The Lift values indicate the strength of the relationships:
The Strongest Cohort (The 2.2+ Lift Groups)
These are the three strongest, non-obvious combinations. A Lift≈2.2 means that students who take one lecture are more than twice as likely to take the associated lecture compared to the general student population.
- L9 ↔ L12 ↔ L8: These three lectures form a tight cluster. Specifically, L8 → L9 and L9 → L12 have extremely high association scores. This suggests a dedicated academic track or a highly correlated set of topics.
High Confidence Groups (The 1.5+ Lift Groups)
These are groups where the selection of one lecture is a very strong predictor for the other:
- L2 → L4 (87.5% Confidence): If a student selects L2, there is a very high, 87.5% chance they also select L4. This suggests L2 might be a prerequisite, a foundational course, or a direct complement to L4.
- L2 → L3 (75.0% Confidence): Similarly, L2 and L3 are frequently chosen together, indicating a strong connection.
- L1 ↔ L2: These two lectures are highly associated, suggesting they are often taken in tandem.
Does this mean that I should go to lecturers L5 and L2 and ask them for promotion of my L6, because it is most likely they find satisfactory experience on my lecture?
Data-Driven Strategy for L6 Promotion
1. Prioritize L5 (High Co-Selection & High Confidence)
You should absolutely focus on the L5 lecturer.
- L5 → L6 Confidence: 72.7%
- This means nearly 3 out of every 4 students who take L5 also choose your L6 lecture.
- Action: The L5 lecturer is teaching the same target audience as you. You could ask them to mention L6 as a natural follow-up or complementary course to their students.
2. Prioritize L2 (High Predictive Power)
The relationship with L2 is even more predictive of a student landing in your lecture.
- L2 → L6 Confidence: 75.0%
- This means 3 out of every 4 students who take L2 end up in L6.
- Action: The L2 lecturer is essentially teaching a foundational course for a majority of your class. Ask them to promote L6 as the direct next step or most relevant application course for their content.
3. The Importance of Satisfaction (What the Data Doesn’t Say)
The data confirms a strong selection link, but not a satisfaction link.
- Selection: L5 and L2 students are your target market.
- Satisfaction: To confirm they find your lecture satisfactory, you’d need student feedback/evaluation data. A student who disliked L6 might still be highly likely to take it if it’s a required course for a specific program, for example.
The strongest rationale for promotion is simply the high overlap: you are addressing a student cohort that already has a demonstrated interest pattern (L5/L2 → L6).
Secondary Focus: L4 and L3
While L4 and L3 have high total co-selection with L6 (L4: 66.7%, L3: 53.3%), their Lift and correlation scores are weaker. This means they are generally popular lectures, and while many of your students take them, the choice of L4 or L3 does not strongly predict the choice of L6.
Focusing your limited promotional time on the lecturers for L5 and L2 will yield the highest return.
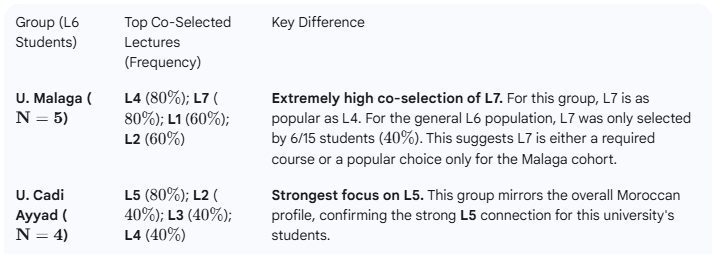
Country and University as moderating factors
The factors of Country and University do show clear patterns in lecture selection among your L6 students, suggesting that existing relationships or shared academic paths likely influence their choices.
Here is the analysis of the moderating factors, based on the 15 students in your L6 lecture:
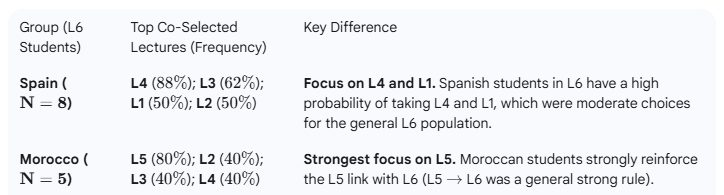
Analyzing the two largest university groups shows even sharper differences, which is expected as they are likely organized groups of students who know each other.
Theoretical Background for Moderating Factors
The Influence of Country: Cultural and Institutional Homophily
The tendency for students from the same country (e.g., Spain or Morocco) to share similar lecture profiles can be explained by Homophily and Institutional Alignment.
| Theory/Concept | Explanation | Application to Your Data |
| Cultural Homophily | The principle that “birds of a feather flock together.” Individuals prefer to associate and bond with others who are similar to themselves (e.g., same nationality, language, cultural background). | Students from the same country are likely to communicate about their choices primarily in their shared native language (e.g., Spanish for Spain, Arabic/French for Morocco). This exchange promotes the selection of a common set of lectures (e.g., Spanish students favoring L4 and L1). |
| Institutional Alignment / Mobility Programs | The structured academic agreements between home and host institutions dictate which courses are approved for credit. | Exchange programs often pre-approve specific “study packages.” If the University of Malaga exchange agreement primarily covers a field requiring L4 and L7, those students will select that bundle. Your finding that Malaga students disproportionately select L7 strongly supports this institutional influence. |
| Country-Level Curriculum/Prerequisites | Students from the same country may have completed similar foundational courses at home, making a certain set of lectures (like L6) compatible. | If Spanish universities standardize a curriculum where L4 is a logical next step to a prerequisite, those Spanish students will follow that path, leading to the high L4 selection. |
The Influence of University/Peer Group: Social Network Effects
The even stronger, more granular influence of the specific university groups (like the unique L7 selection by U. Malaga students) is supported by Social Influence Theory and Bounded Rationality.
| Theory/Concept | Explanation | Application to Your Data |
| Social Proof / Herd Behavior | A type of conformity where individuals assume the actions of a large group in an attempt to reflect correct behavior. When students face uncertainty in a new academic environment, they look to their trusted peers for guidance. | Students arriving from the same university (e.g., U. Cadi Ayyad) form a tight local network. When one or two students select a lecture (like L5), the rest of the group follows to reduce the perceived risk and workload associated with taking classes alone. |
| Network Constraint / Information Asymmetry | The limited size of a local network dictates the information flow. Students only trust information from their close peers, ignoring broader student trends. | The U. Malaga students may not interact with the U. Cadi Ayyad students. Therefore, they only hear about the “safe” lecture bundle (e.g., L4, L7, L1) from their U. Malaga friends, leading to the highly specific, unique selection of L7. |
| Convenience/Logistics | At a practical level, coordinating lecture selection allows peers to have the same class schedule, making group projects, social planning, and travel easier. | The high co-selection of L4, L7, L1, and L2 among U. Malaga students suggests they are coordinating their choices to minimize logistical friction, effectively treating the selection as a group decision. |
By applying these concepts, you can elevate your analysis from mere correlation to a discussion of student decision-making under conditions of uncertainty and social constraint.
The lecture title informational role
Assuming that students red only the lecture titles can you analyze the whole population and discover which lectures students select as a group (l1 & l2 … ect.) based on title informational role.
This is an excellent way to use the data to understand the thematic logic that guides students’ decisions, rather than just the frequency. By analyzing the corpus of words in the high-Lift lecture titles, we can discover the “driving wording” that creates strong, predictable co-selection patterns.
The primary driving themes are Economics, Management, and Business, but the strongest associations occur when these words are combined with qualifying terms like International, Applied, or Process.
Analysis of Driving Wording in Lecture Titles
Based on the highest Lift scores (strongest association patterns), the lecture groups cluster into four distinct thematic tracks driven by specific keywords:
1. Driving Theme: International & Political Economy 🌍
This is the strongest thematic driver in the entire dataset, creating three of the top four co-selection groups.
| Lecture Group | Titles & Key Wording | Driving Wording Logic |
| L9 & L12 (Lift 2.232) | L9: International Economics / L12: Political economy | Students seek a deep understanding of how global power (Political) and global markets (International) interact. The co-selection is driven by the desire to merge theoretical macroeconomics with political strategy. |
| L8 & L9 (Lift 2.232) | L8: International Competitiveness / L9: International Economics | The term “International” is the central driver. Students are selecting a specialized track in global trade, where L9 provides the foundational theory and L8 provides the policy application (Competitiveness). |
Driving Wording: International, Economy, Political.
2. Driving Theme: Applied Economic Analysis
This theme links foundational economic knowledge with quantitative skills and real-world application.
| Lecture Group | Titles & Key Wording | Driving Wording Logic |
| L1 & L2 (Lift 2.083) | L1: Analysis of… Economic and Social Indicators / L2: Applied Economics Real-World Challenges | The core terms “Analysis” and “Applied” signal a curriculum path focused on practical data skills (L1) to solve real-world problems (L2), appealing to students who want measurable, deployable skills. |
| L2 & L3 (Lift 1.562) | L2: Applied Economics / L3: Business Analytics for Financial Decisions | The combination of “Applied” and “Analytics” defines a quantitative financial student. They select L2 for the general economic context and L3 for the specific financial toolset. |
Driving Wording: Applied, Analysis, Economics, Decisions.
3. Driving Theme: Business Management & Strategy
This group is driven by a focus on business processes and the organizational changes brought by technology.
| Lecture Group | Titles & Key Wording | Driving Wording Logic |
| L7 & L11 (Lift 1.786) | L7: Economics of Innovation / L11: People management in the digital economy | The terms “Innovation” and “Digital” are the semantic link. Students are building a profile focused on managing organizations in a rapidly changing, technology-driven environment, linking macro strategy (L7) with HR/people skills (L11). |
| L5 & L6 (Lift 1.212) | L5: Business process management / L6: Customer Experience Management | The recurring term “Management” creates the link. L5 focuses on the internal view (Process) and L6 focuses on the external view (Customer), showing students seek comprehensive skills for managing the entire value chain. |
Driving Wording: Management, Process, Digital, Innovation.
Summary of Driving Wording
The strongest selection drivers are not single words but rather qualified thematic phrases that define an academic specialization:
Modern Business Specialization: Driven by Management combined with Process or Digital/Innovation (L5, L6, L7, L11).
Macro/Global Specialization: Driven by International and Political Economy (L9, L12, L8).
Quantitative Specialization: Driven by Applied Economics and Business Analytics (L2, L3, L1).
About wording analysis you can read here: Organizational aspiration for social impact
What recommendation to lecture L6 in wording. How can I modify or extend title of L6 to experiment for more students in next period.
The goal is to maximize enrollment by aligning the L6 title with the thematic drivers of the most predictive lectures (L5, L2, L4). Your current title is L6: Customer Experience Management.
Here are the recommendations for wording modifications, structured by the target student profile you want to attract:
Recommended Title Modifications for L6
Strategy 1: Attract L5 Students (Strongest Existing Link)
The L5 title is Business process management. These students seek internal efficiency as a foundation for external success.
| Recommendation | Suggested Title (Experiment 1) | Rationale |
| Integrate “Process” | L6: Customer Experience Management and Service Design Process | By including the word “Process,” you explicitly link L6 to the operational skills L5 students value, making it the logical next step for their expertise. |
| Focus on Value | L6: Managing Business Processes for Customer Value and Experience | This title frames L6 as the culmination of L5, showing how mastering L5’s internal processes directly leads to the high-value outcome of great customer experience. |
Strategy 2: Attract L2/L4 Students (Applied & Analytical)
The L2 title is Applied Economics Real-World Challenges and Solutions. L4 is Business plan. These students are practical and analytical.
| Recommendation | Suggested Title (Experiment 2) | Rationale |
| Integrate “Analytics” | L6: Customer Experience Analytics: Data-Driven Strategies for Service Improvement | The term “Analytics” strongly attracts L2/L4 students (who also take L3: Business Analytics…). This signals that L6 is a quantitative course, not just a soft skill. |
| Focus on “Metrics/KPIs” | L6: Customer Experience Management: Measuring and Optimizing Key Service Metrics | This appeals to the Applied/Solutions mindset, promising tools to measure CX performance and directly influence business outcomes, fitting the L2/L4 focus on solutions and planning. |
Strategy 3: Attract L7/L11 Students (Future/Digital Focus)
The L7/L11 titles feature Innovation and Digital Economy.
| Recommendation | Suggested Title (Experiment 3) | Rationale |
| Integrate “Digital” | L6: Digital Customer Experience (DCX) Management | The term “Digital” is a powerful modern driver. If your course includes any digital touchpoints (apps, online service, social media), using “DCX” will immediately pull in the students from the L7/L11 “Innovation” track. |
Final Recommendation: The Best Title to Test
The most balanced and powerful title that leverages multiple co-selection themes is: Customer Experience Management: Data, Process, and Digital Strategy
This phrase:
- Includes Management (L5, L6, L11 theme).
- Includes Process (L5 link).
- Includes Data (L2/L3 Analytics link).
- Includes Digital Strategy (L7/L11 Innovation link).
Thank you for reading.