Fuzzy-Set Qualitative Comparative Analysis
Qualitative comparative analysis (QCA) is an asymmetric data analysis technique that combines the logic and empirical intensity of qualitative approaches.
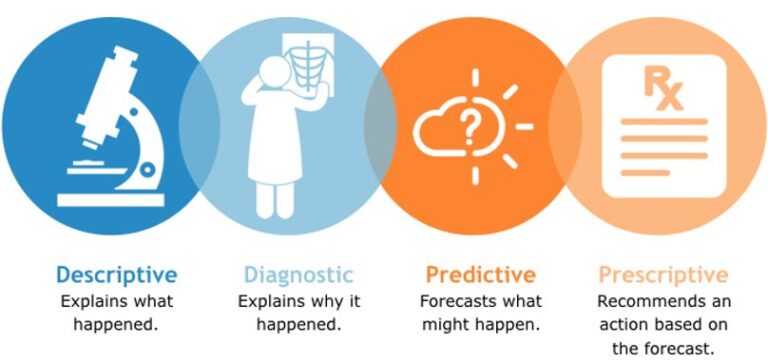
The symmetric data analysis (e.g., correlation and multiple regression analysis) …
The asymmetric data analysis (i.e., individual case outcome forecasts) …
Based on: Fuzzy-set Qualitative Comparative Analysis (fsQCA): Guidelines for research practice in Information Systems and marketing (Ilias O. Pappas, Arch G. Woodside)
Qualitative inductive reasoning with data being analyzed “by case’’ and not “by variable’’, is combined with quantitative empirical testing, as sufficient and necessary conditions identify outcomes through statistical methods. In most cases, QCA are useful in quantitative studies, as it allows the researcher to get a deep view of their data through a quantitative analysis. That has also several characteristics of qualitative analysis.
Case studies focus on describing, explaining, and forecasting, single and combinatorial conditional antecedents on outcomes while variable studies focus on the similarities of variances of two or more variables. A “condition” is a point or interval range of antecedent or outcome; a “variable” characteristic varies.
Here are few examples of conditions versus variables: “Male” is a condition; “gender” is a variable. “Swedish” is a condition; “nationality” is a variable. “Expert” is a condition; “expertise” is a variable.
The goal of QCA is to explain causality in complex real life phenomena. QCA goes through “multiple-conjunctural causation, which refers to “nonlinear, nonadditive, non-probabilistic conception that rejects any form of permanent causality. That stresses different paths which can lead to the same outcome. QCA investigate complex combinations of conditions and diversity. QCA uses Boolean algebra and Boolean minimization algorithms to capture patterns of multiple-conjunctural causation and to simplify complex data structures.
Types qualitative comparative analysis (QCA)
CsQCA and mvQCA
CsQCA is the first variation of QCA. It is a tool created to deal with complex sets of binary data. The use of Boolean algebra means that QCA has as input binary data (0 or 1). That make QCA uses logical operations for the procedure. Thus it is very important to dichotomize the use of variables in a useful and meaningful manner.
mvQCA, treats variables as multi-valued instead of dichotomous. MvQCA retains the idea of performing a synthesis of the dataset and cases with the same value on the outcome variable. They are explained by a solution, which contains combinations of variables that explain a number of cases with the outcome.
FsQCA addresses an important limitation of csQCA, the fact that variables are binary, thus restricting the analysis as it cannot fully capture the complexity in cases that naturally vary by level or degree. This restriction of csQCA is likely an important reason that QCA has not been widely adopted in multiple contexts, including IS and marketing research. FsQCA extends csQCA by integrating fuzzy-sets and fuzzy-logic principles with QCA. The variables can get all the values within the range of 0–1. FsQCA is able to overcome several limitations of both csQCA and mvQCA, and has received increased attention recently. FsQCA applies together with complexity theory, it provides the opportunity to gain deeper and richer insight into data.

FsQCA and cluster analysis
Case-based techniques, such as fsQCA and cluster analysis, have been employed as a way of moving beyond variance-based methods. These two techniques have similarities as they both employ multidimensional spaces and often people ask how fsQCA differs from cluster analysis and why do we need it. A main difference between the two methods is the kind of research questions they are able to address.
Specifically, cluster analysis answers questions such as which cases are more similar to each other, while fsQCA can identify the different configurations that constitute sufficient and/or necessary conditions for the outcome of interest. Depending on the focus of the study the researcher should choose the most appropriate method. Their differences stem from the fact that “QCA addresses the positioning of cases in [multidimensional] spaces via set theoretic operations while cluster analysis relies on geometric distance measures and concepts of variance minimization” . To this end, prior studies compare fsQCA with cluster analysis and show how fsQCA can handle causal complexity with fine-grained level data, or how it can identify more solutions compared to cluster analysis. A discussion exists in the literature regarding QCA and cluster analysis, and both approaches have differences making them suitable for different types of studies.
read example here: Hierarchical Agglomerative Clustering for Product Grouping
Adoption of fsQCA in relevant studies
Configurational approaches are becoming more popular over the past few years in different areas, with fsQCA playing a large part in this as most studies will prefer fuzzy-set over crisp-set and multi-value QCA (Thiem & Dusa, 2013). In detail, fsQCA has been employed in information systems (Fedorowicz, Sawyer, & Tomasino, 2018; Liu et al., 2017), online business and marketing (Pappas et al., 2016; Pappas, 2018; Woodside, 2017), consumer psychology (Schmitt, Grawe, & Woodside, 2017), strategy and organizational research (Fiss, 2011; Greckhamer et al., 2018), education (Pappas, Giannakos et al., 2017; Plewa, Ho, Conduit, & Karpen, 2016), data science (Vatrapu, Mukkamala, Hussain, & Flesch, 2016) and learning analytics (Papamitsiou et al., 2018; Sergis, Sampson, & Giannakos, 2018). This tutorial aims to increase the adoption of fsQCA in IS and marketing studies following the call for more empirical work in the area (El Sawy, Malhotra, Park, & Pavlou, 2010; Fiss, 2011; Woodside, 2014, 2017).
Adoption of fsQCA in relevant studies
FsQCA is useful for both inductive and deductive reasoning for theory building, elaboration, and testing. This analysis allows to identify specific cases in the sample. With this knowledge, the researcher can go back to the cases and use contextual information, not including in the analysis, to further explain and discuss the findings.
A typical variance-based analysis would identify a single best solution, thus limiting the results. FsQCA studies can compare the findings between different data analysis techniques to describe how different stories are hidden in the same dataset. It is recommended to combine fsQCA with other data analysis techniques if possible.
How to use fsQCA in a typical e-commerce study
Sampling
The study examined cognitive and affective perceptions as antecedents of online shopping behavior in personalized e-commerce environments. We used a typical a snowball sampling methodology to recruit participants and controlled for respondents’ previous experience with both online shopping and personalized services. Eventually, the sample comprises 582 individuals with experience in online shopping and personalized services. We collected data through a questionnaire built with measures that have been adopted from the literature. Appendix A (as presented in the original study) lists construct definitions, the questionnaire items used to measure each construct, along with descriptive statistics and loadings.
Evaluate constructs for reliability and validity
Typical with similar quantitative studies, first we evaluate constructs for reliability and validity. This is a step that should be always performed when it is appropriate, and it is not directly related with the fsQCA analysis as it depends on the type of variables that are used in the study. Construct reliability and validify, as the name implies, refer to the construct itself and not to the method of analysis used to examine relations between constructs.
Reliability testing, based on the Cronbach alpha indicator, showed acceptable indices of internal consistency since all constructs exceed the cut-off threshold of 0.70. The AVE for all constructs ranged between 0.55 and 0.84, all correlations were lower than 0.80, and square root AVEs for all constructs were larger than their correlations. The findings in detail for the confirmatory analysis may be found in the original paper.
Contrarian case analysis
Contrarian case analysis is performed outside fsQCA, but we present it here because it can serve as an easy and quick way to examine how many cases in our sample are not explained by main effects, and thus they would not be included in the outcome of a typical variance-based approach, e.g., correlation or regression analysis.
Data Calibration
In fsQCA, different from traditional methods, instead of working with probabilities data are transformed from ordinal or interval scales into degrees of membership in the target set, which shows if and how much a case belongs into a specific set. “In essence, a fuzzy membership score attaches a truth value, not a probability, to a statement”.
For example, the variable intention to purchase can be coded as “high intention to purchase”, and we will be looking for the presence or absence of the condition high intention to purchase (“intention to purchase” is the variable; “high intention to purchase” is a condition). Similarly, we code the rest of the variables.
The method computes the presence of a condition or its opposite (i.e., negation). The negation of a condition is referred in the literature as the absence of a condition, and the two terms have been used interchangeably based on how the absence is computed. The term absence has been also used to describe when the condition is irrelevant in a configuration. It is similar to the “do not care” term that is also often used in the literature.
This distinction is not often addressed or clarified, thus we suggest researchers to clearly define these terms in future works to avoid misunderstandings.
Transform data into fuzzy-sets
In fsQCA we need to calibrate our variables to form fuzzy sets with their values ranging from 0 to 1. Consider a fuzzy set as a group, then the values from 0 to 1 define if and at what amount a case belongs to this group. The fact that all values range from 0 to 1 means that a case with a fuzzy membership score of 1 is a full member of a fuzzy set (fully in the set), and a case with a membership score of 0 is a full non-member of the set (fully out of the set). A membership score of 0.5 is exactly in the middle, thus a case would be both a member of the fuzzy set and a non-member, and is therefore a member of what is known as the intermediate set. The intermediate-set point is the value where there is maximum ambiguity as to whether a case is more in or more out of the target set.
Data calibration may be either direct or indirect. In the direct calibration the researcher needs to choose exactly three qualitative breakpoints, which define the level of membership in the fuzzy set for each case (fully in, intermediate, fully out). In the indirect method, the measurements need to be rescaled based on qualitative assessments. The researcher may choose to calibrate a measure differently, depending on what one is investigating. Either method may be chosen, depending on researcher’s substantive knowledge of both data and underlying theory. The direct method is recommended and is more common, in which the researcher sets three values corresponding to full-set membership, full-set non-membership, and intermediate-set membership. This can lead to more rigorous studies which are easier to be replicated and validated, since it is clearer on how the thresholds have been chosen.
The percentiles allow the calibration of any measure regardless of its original values. In detail, we can compute the 95 %, 50 %, and 5 % of our measures and use these values as the three thresholds in fsQCA software.
Especially in the case of the widely used seven-point Likert scales (1=Not at all, 7=Very much), previous studies suggest that the values of 6, 4, and 2 can be used as thresholds. Similarly, for a five-point Likert scale the thresholds could be 4,3, and 2.
Interpreting and presenting the solutions
FsQCA software provides all three solutions every time. Complex and parsimonious solutions are computed regardless of any simplifying assumptions employed by the researcher (e.g., choosing the presence or absence/negation of a variables) while the intermediate solution depends on these assumptions. While the intermediate solution includes both core and peripheral conditions, we need an easy way to make the distinction that will help us interpret and present the solutions in a better manner.
To improve the presentation of the findings we can transform the solutions from fsQCA output into a table that is easier to read. Typically,
- the presence of a condition is indicated with a black circle (●),
- the absence/negation with a crossed-out circle (⊗),
- and the “do not care” condition with a blank space.
The negation of a condition is referred in the literature also as absence, and the two terms have been used interchangeably. The distinction between core and peripheral is made by using large and small circles, respectively. The researcher needs to present the overall solution consistency and the overall solution coverage. The overall coverage describes the extent to which the outcome of interest may be explained by the configurations, and is comparable with the R-square reported on regression-based methods. In our example, the results indicate an overall solution coverage of 0.84, which suggests that a substantial proportion of the outcome is covered by the nine solutions.
All graphics and futher explanation you find here: Pappas, I. O., & Woodside, A. G. (2021). Fuzzy-set Qualitative Comparative Analysis (fsQCA): Guidelines for research practice in Information Systems and marketing. International journal of information management, 58, 102310.