
What are independent variables?
Independent variables, also called predictors, features, or explanatory variables, are the variables in a statistical or machine learning model that are used to explain or predict changes in another variable — the dependent variable, also called the outcome or target.
Independent variables in simple terms:
- Independent variables: Inputs you control or observe.
- Dependent variable: Output you want to understand or predict.
Example of independent variables in Customer Management (RFM Model):
Suppose you’re analyzing customer behavior to predict churn (whether a customer will stop buying).
- Independent variables:
- Recency: How recently a customer made a purchase.
- Frequency: How often they purchase.
- Monetary: How much they spend.
- Dependent variable:
- Churn: 1 if the customer churned, 0 if they stayed.
In this case, Recency, Frequency, and Monetary are independent variables used to predict the likelihood of churn. See also Python for business analytics – rfm analysis
Why check for independence among independent variables?
If independent variables are highly correlated with other variables, i.e., it is not truly independent, it can cause multicollinearity, which makes model coefficients unstable, reduces interpretability, and can lead to misleading conclusions.
Multicollinearity
Multicollinearity refers to a statistical phenomenon in which two or more independent variables in a regression model are highly correlated. This makes it difficult to determine the individual effect of each variable on the dependent variable because they essentially carry overlapping information.
Assessment of Multicollinearity
To assess multicollinearity, you can use following methods:
- Correlation Matrix
- Check pairwise correlations between independent variables.
- High correlation (e.g., > 0.8 or < -0.8) may indicate multicollinearity.
- Variance Inflation Factor (VIF)
- Measures how much the variance of a regression coefficient is inflated due to multicollinearity.
- VIF > 5 or 10 is often considered problematic.
- Tolerance
- Tolerance = 1 / VIF.
- Low tolerance values (close to 0) indicate high multicollinearity.
- Condition Index and Eigenvalues
- Part of a more advanced diagnostic using matrix decomposition.
- A condition index > 30 may suggest serious multicollinearity.
How to deal with multicollinearity?
- Remove one of the correlated variables.
- Combine variables (e.g., using PCA or creating an index).
- Regularization techniques like Ridge or Lasso regression.
- Centering variables (subtracting the mean) can help in some cases.
Calculation example
Assume, you have data similar to this sample.
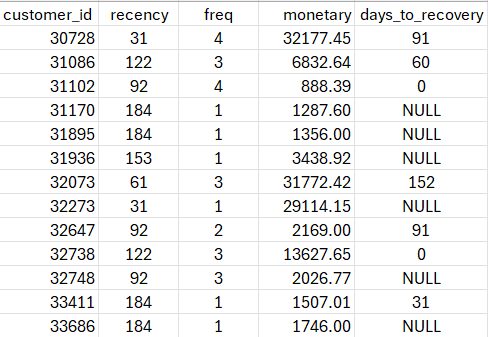
Variable independence testing
import pandas as pd

# Load the data with the specified delimiter
df = pd.read_csv("RFM_analysis_614.csv", delimiter=",")

from statsmodels.stats.outliers_influence import variance_inflation_factor
from statsmodels.tools.tools import add_constant

# Select the independent variables (RFM)
X = df[['recency', 'freq', 'monetary']]

# Add a constant for the VIF calculation (required by the statsmodels function)
X = add_constant(X)

# Create a DataFrame to hold the VIF results
vif_data = pd.DataFrame()
vif_data["Variable"] = X.columns
vif_data["VIF"] = [variance_inflation_factor(X.values, i) for i in range(X.shape[1])]

# Exclude the constant row from the final output since it's not a true variable
vif_data = vif_data[vif_data.Variable != 'const'].reset_index(drop=True)

print(vif_data)

# Save the VIF results to a CSV file
vif_data.to_csv("vif_results.csv", index=False)Finally program prints following results
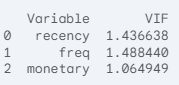
Based on the Variance Inflation Factor (VIF) calculation, the columns recency, frequency, and monetary are statistically independent of each other and not informationally overlapping.
This means that you can use all three variables together as independent predictors in a statistical model, such as a Cox Proportional Hazards (Cox PH) model, without concern for severe multicollinearity.
Variance Inflation Factor (VIF) Results
The VIF (https://en.wikipedia.org/wiki/Variance_inflation_factor) is a measure of how much the variance of an estimated regression coefficient is increased due to collinearity. A common rule of thumb is that a VIF value less than 5 or sometimes 10 indicates that the correlation between the variables is not high enough to warrant concern.
The calculated VIF values for your RFM variables are very low:
| Variable | VIF |
| recency | 1.437 |
| freq | 1.488 |
| monetary | 1.065 |
Conclusion on Independence
Since all VIF values are close to 1.0 and well below the 5.0 threshold:
- Independent Variables: You can confidently treat recency, frequency, and monetary as independent variables for your statistical analysis (e.g., in a Cox PH model).
- No Informational Overlap: The variables are providing distinct, non-redundant information to the model. For instance, knowing a customer’s frequency does not allow the model to strongly predict their recency or monetary value.