Python for analysts most important datetime functions
Python’s powerful date and time functions using the datetime and pandas libraries gives you a robust date table ready for Power BI and other business intelligence and analytical tools. Python for analysts most important datetime functions.
Mastering Date and Time Functions in Python for Power BI Date Tables
When working with Power BI, a well-structured Date Table is essential for time intelligence calculations like YTD, QTD, MTD, and custom period comparisons. While Power BI has built-in date table features, using Python to generate a custom date table gives you full control over the structure, granularity, and logic.
In this post, we’ll explore Python’s powerful date and time functions using the datetime and pandas libraries, and show how to create a robust date table ready for Power BI.
Python for analyst – date and time functions – basics
Python provides the datetime module to work with dates and times. Here’s a quick overview:
from datetime import datetime, timedelta, date

# Current date and time
now = datetime.now()
print("Now:", now)

# Just the date
today = date.today()
print("Today:", today)

# Add 7 days
next_week = today + timedelta(days=7)
print("Next week:", next_week)

# Subtract 30 days
last_month = today - timedelta(days=30)
print("30 days ago:", last_month)
These functions are the foundation for generating date ranges and calculating custom columns like fiscal periods or holidays. Python for analysts most important datetime functions.
Creating a Date Range with Pandas
To build a date table, we need a continuous range of dates. pandas.date_range() is perfect for this:
import pandas as pd

# Generate a date range from 2020 to 2030
date_range = pd.date_range(start='2020-01-01', end='2030-12-31', freq='D')
df = pd.DataFrame({'Date': date_range})
This gives us a DataFrame with one row per day — the backbone of our date table.
Enriching the Date Table
Now let’s add useful columns for Power BI:
df['Year'] = df['Date'].dt.year
df['Month'] = df['Date'].dt.month
df['MonthName'] = df['Date'].dt.strftime('%B')
df['Quarter'] = df['Date'].dt.quarter
df['Day'] = df['Date'].dt.day
df['Weekday'] = df['Date'].dt.weekday + 1  # Monday = 1
df['WeekdayName'] = df['Date'].dt.strftime('%A')
df['IsWeekend'] = df['Weekday'].isin([6, 7])
df['Week'] = df['Date'].dt.isocalendar().week
df['DayOfYear'] = df['Date'].dt.dayofyear
These columns allow for slicing and dicing your data in Power BI by year, month, weekday, and more.
Fiscal Calendar Support
Many businesses use fiscal calendars that don’t align with the calendar year. Here’s how to add a fiscal year starting in July:
df['FiscalYear'] = df['Date'].apply(lambda x: x.year if x.month < 7 else x.year + 1)
df['FiscalMonth'] = df['Date'].apply(lambda x: x.month - 6 if x.month >= 7 else x.month + 6)
df['FiscalQuarter'] = ((df['FiscalMonth'] - 1) // 3) + 1
This logic adjusts the fiscal year, month, and quarter based on a July start. Python for analysts most important datetime functions
5. Flags for Time Intelligence
Power BI benefits from flags that simplify DAX calculations:
today = pd.to_datetime('today').normalize()

df['IsToday'] = df['Date'] == today
df['IsCurrentMonth'] = (df['Date'].dt.month == today.month) & (df['Date'].dt.year == today.year)
df['IsCurrentYear'] = df['Date'].dt.year == today.year
You can also add flags for holidays, fiscal periods, or custom business logic. Python for analysts most important datetime functions
Exporting to CSV for Power BI
Once your date table is ready, export it:
df.to_csv('DateTable.csv', index=False)
You can now import this CSV into Power BI as a static date table.
7. Sample Output
Here’s a preview of what your date table might look like:
| 2025-01-01 | 2025 | 1 | January | 1 | Wednesday | False | 2025 | False |
| 2025-07-01 | 2025 | 7 | July | 3 | Tuesday | False | 2026 | False |
| 2025-12-25 | 2025 | 12 | December | 4 | Thursday | False | 2026 | False |
Pandas to_datetime() function
Python for analysts most important datetime functions – pandas
 #   Column                  Non-Null Count  Dtype
---  ------                  --------------  -----
 0   CustomerId              13483 non-null  int64
 1   Dt_first_rew_income     2987 non-null   datetime64[ns]
 2   Dt_first_purchase       13483 non-null  object
 3   Dt_last_purchase        13483 non-null  object

df_cust['Dt_first_purchase'] = pd.to_datetime(df_cust['Dt_first_purchase'],format="yyyy-mm-dd")
df_cust['Dt_last_purchase'] = pd.to_datetime(df_cust['Dt_last_purchase'],format="yyyy-mm-dd")

 #   Column                  Non-Null Count  Dtype
---  ------                  --------------  -----
 0   CustomerId              13483 non-null  int64
 1   Dt_first_rew_income     2987 non-null   datetime64[ns]
 2   Dt_first_purchase       13483 non-null  datetime64[ns]
 3   Dt_last_purchase        13483 non-null  datetime64[ns]
Advanced Tips
- Holidays: Use external APIs or CSVs to mark public holidays.
- Week Start: Adjust
Weekdayto match your locale (e.g., Monday vs. Sunday). - Time Zones: Use
pytzorzoneinfofor timezone-aware datetime handling. - Dynamic Updates: Automate the script to regenerate the table monthly or yearly.
Certainly! Here’s a concise 400-word post on SQL Date and Time Functions, with examples, tailored for building a Date Table in Power BI:
SQL Date and Time Functions for Power BI Date Tables
When building reports in Power BI, a comprehensive Date Table is essential for enabling time-based calculations like YTD, MTD, and custom period comparisons. While Power BI can auto-generate a date table, using SQL to create one gives you full control over its structure and logic.
Let’s explore key SQL Server date and time functions and how to use them to build a robust date table.
1. Generating a Date Range
To create a date table, you need a continuous range of dates. In SQL Server, you can use a loop or a recursive CTE:
DECLARE @StartDate DATE = '2020-01-01';
DECLARE @EndDate DATE = '2030-12-31';

WITH DateCTE AS (
    SELECT @StartDate AS DateValue
    UNION ALL
    SELECT DATEADD(DAY, 1, DateValue)
    FROM DateCTE
    WHERE DateValue < @EndDate
)
SELECT * INTO DateTable FROM DateCTE
OPTION (MAXRECURSION 32767);

select * from DateTable
Here the example
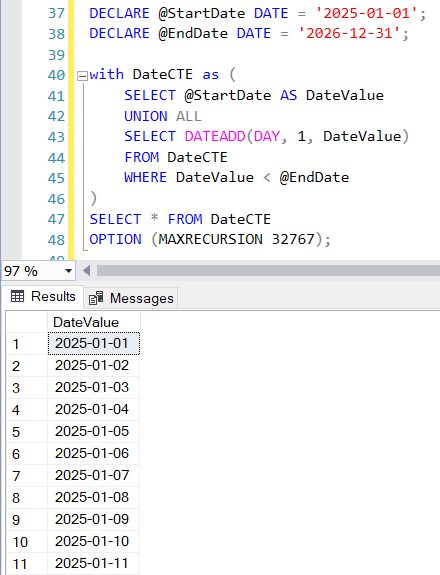
This creates a table with one row per day between 2020 and 2030.
2. Adding Date Attributes
Once you have the base dates, enrich them with useful columns:
ALTER TABLE DateTable ADD
    Year INT,
    Month INT,
    MonthName VARCHAR(20),
    Quarter INT,
    Weekday INT,
    WeekdayName VARCHAR(20);

UPDATE DateTable
SET
    Year = YEAR(DateValue),
    Month = MONTH(DateValue),
    MonthName = DATENAME(MONTH, DateValue),
    Quarter = DATEPART(QUARTER, DateValue),
    Weekday = DATEPART(WEEKDAY, DateValue),
    WeekdayName = DATENAME(WEEKDAY, DateValue);
These columns allow for flexible filtering and grouping in Power BI.
3. Fiscal Calendar and Flags
You can also add fiscal logic and flags:
ALTER TABLE DateTable ADD FiscalYear INT;

UPDATE DateTable
SET FiscalYear = CASE
    WHEN MONTH(DateValue) >= 7 THEN YEAR(DateValue) + 1
    ELSE YEAR(DateValue)
END;
Add flags like IsWeekend, IsToday, or IsCurrentMonth to simplify DAX expressions.
Conclusion
Python offers a flexible and powerful way to create a custom date table for Power BI. With just a few lines of code, you can generate a rich dataset that supports advanced time intelligence and reporting needs.
Whether you’re working with fiscal calendars, custom flags, or multilingual support, Python gives you the tools to tailor your date table exactly to your business requirements.
SQL’s date and time functions like DATEADD, DATEPART, DATENAME, and YEAR are powerful tools for building a custom date table. Once created, export it to Power BI or use it as a view for dynamic reporting.
Would you like a ready-to-run SQL script for a complete date table?
Find more resources in our course of Advanced programming for business analysts